Monday 20 April 2015

Should the cash rate have been cut on Tuesday?

Blog Post 6 | 9th April 2015

Should the cash rate have been cut on Tuesday?

Callam Pickering from Business Spectator wrote a great follow up piece to the absence of a cash rate cut on Tuesday entitled Has monetary policy failed Australia’s economy? The article raised the question ‘What’s the counterfactual?’ … i.e. ‘Based on the historical relationship between interest rates and growth, there is a non-trivial possibility that if the cash rate was at, say, 3.5 or 4 per cent, then the Australian economy would either be in a recession or well on its way to one.’ Callam raises a very interesting point of the consequences of not cutting the cash rate in time before it causes adversity to economic growth and conditions, and having formerly worked for the Reserve Bank of Australia his opinion is one of validity. 

Wednesday 8 April 2015

An April Cash rate cut is looking more likely

Blog Post 5 | 3rd April 2015

An April Cash rate cut is looking more likely

The 30, 90 and 180 Bank Accepted Bills (BABs) have all dipped below the Cash rate in recent days. This will put pressure on the RBA to reduce the Cash rate this coming Tuesday when it goes to board for this month. Chart 5.1 shows the BABs rates against the Cash rate for 2015:

Chart 5.1 
 
Preliminary research indicates the annual inflation rate rose to 1.5 per cent last month, which is still below the RBAs 2 to 3 per cent target range. This also supports the case for a lower cash rate this month.

Monday 6 April 2015

More signals for lower interest rates

Blog Post 4 | 23rd March 2015

More signals for lower interest rates

The market for 3 year CGS did stabilise in mid-February to mid-March, with yields rising back to a normal level above 2 year CGS yields. However, this was short lived as demand for 3 year CGS has driven the yield again below 2 year CGS yields in recent days. See table 4.1 below:

Table 4.1

Who is paying the additional interest on the debt?

Blog 3 | 24th February 2015

Who is paying the additional interest on the debt?

Much has changed in the world since the Financial Crisis of September 2008. Structural changes to financial markets have been a necessary evolution from this broadly unforeseen event. One of the major structural changes here in Australia has been the issuance of Commonwealth Government Securities (CGS) that has grown over 6 fold since September 2008; Australian Financial Intermediaries(AFIs) being are the largest domestic buyers of these instruments. The main reason for this is to ensure that in the event of a future financial crisis here in Australia the RBA would be able to inject liquidity into to AFIs quickly by printing currency and buying these holdings of bonds from the AFIs in a process known as Quantitative Easing (QE). This precautionary measure places the Australian banking system in much better position to weather a financial storm, but does come at a price. Chart 3.1 shows the change in the holdings of CGS and local and semi-government and other public authority securities by AFIs since January 2000.

Chart 3.1

The Australian Office of Financial Management (AOFM) is the body responsible for managing the market for issuing CGS. They regularly update the value of CGS on issue on their website www.aofm.gov.au. Graph 3.2 shows the growth in CGS on issue since January 2000.

Chart 3.2

As at January 2000 when the Cash Rate was 5% interest on CGS was an average of 6.88% pa (across the 2yr, 3yr, 5yr and 10yr terms), which on an account of AU$79.78 billion was AU$5.49 billion pa. As at September when the Cash Rate was 2.5% interest on CGS was an average of 3.01% pa (across the 2yr, 3yr, 5yr and 10yr terms), which on an account of AU$368.47 billion was AU$11.10 billion. Chart 3.3 shows the quarterly change in annual interest on CGS since March 2000.

Chart 3.3
 

The question is - who is paying the additional interest on the debt? And, who should be responsible to pay it?

Cut or Not To Cut…

Blog post 2 | 3rd February 2015

Cut or Not To Cut…

As we get closer to the release of the RBA’s interest rate decision release today at 2.30pm AEDT, one of the key factors they will need to take into account is the Bank Accepted Bills (BAB) data which estimates end of day bank bill rates. See Chart 2.1 below:

Chart 2.1


Without an interest rate cut and an increase in the supply of liquidity, the cost of funding between the banks in the short-term will undoubtedly rise.  

Interest Rates in 2015

Blog post 1 | 6th January 2015

Interest Rates in 2015

Happy New Year everyone!

We thought it would be a great idea to kick off 2015 with a blog to help provide more information around what is happening in the Australian economy. 2014 was an economically challenging year on many fronts; the Federal Government’s efforts to balance the budget have put negative pressure on national spending, the consistent downward trend of commodity prices since February-March 2014 has downsized the flow of funds from the mining boom, unemployment has steadily crept up to 6.3%, and business and consumer confidence are both declined to lows in the final reports of the year.

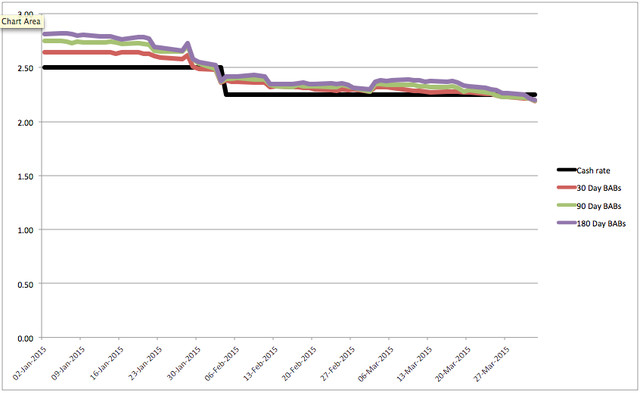
It is for this reason that many senior banking economists have revised their outlook for future changes to Cash Rate by Reserve Bank of Australia (RBA). NABWestpac and Deutsche Bank all foresee a 0.5 percentage point cut for 2015, with a 0.25 percentage point cut in first few months of the year. This prediction is in line with the trending market yields on Commonwealth Government Securities (CGS), which are bonds issued by the Federal Government. Chart 1.1 shows this relationship in a graph.

Chart 1.1


The market for CGS is seen to historically lead the Cash Rate, as these yields are a reflection of the market price for the future value of money. The Cash Rate is the interest rate that the RBA sets in the market for overnight funds between the banks. When the RBA reduces the Cash Rate they increase the supply of cash (currency), which in turn dilute the value of money into the future.

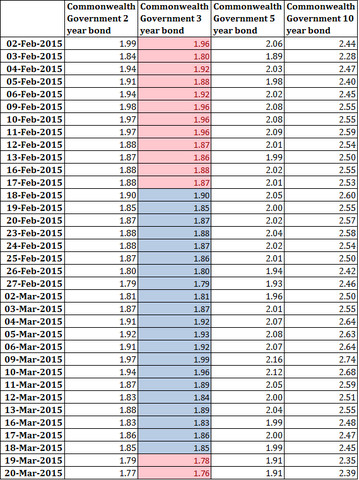
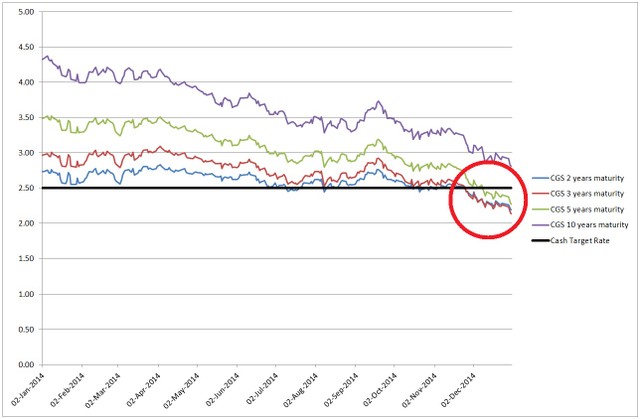
Chart 1.2 shows a close up of the resent downward trend of CGS.

Chart 1.2

CGS to Cash Rate

Note the trend of 2 year and 3 year CGS circled in red; 3 year CGS have in recent weeks trended lower than 2 year CGS. What this indicates is that investors (albeit fund managers who represent their investors) expect interest rates to be lower for longer so they see more value in holding 3 year bonds over 2 year bonds. In other words, investors are not confident that the Australian economy will improve enough to warrant the RBA to raise the Cash Rate any time soon.

Ultimately, if the market for CGS continues to decline it is likely that we will see interest rate cuts into 2015.